DrawingBoard, a comprehensive add-in for Microsoft PowerPoint

3000+ templates, 140+ tools to gratify your PowerPoint Experience.

1000s of editable shapes, icons and lot more at your finger tips!

Search and drag-and-drop the shape into your slide and start customizing it.

Rich collection of shapes classified into easy and intuitive categories

Download a category from our object store and start using it instantly!

Boost your productivity with 100+ custom built tools!

Create calendar, Harvey’s, Clocks, and other awesome formations in no time!

Awesome infographics in no time with DrawingBoard's IntelliShapes!

Concentric circles, Split triangles and a lot more, in seconds.

Tuesday 11 June 2019

Cut, divide and trim shapes and images using DrawingBoard Slicer Tool !!!

At times, splitting a shape or an image can be very meaningful. The split parts can be formatted separately to create stunning visuals which bring magical effect into your presentation. Check it out!!

PowerPoint Infographics, business templates, awesome tools!
Slice any PowerPoint Shape in seconds! 


But splitting a shape manually can be a very tiresome job. DrawingBoard’s Slice tool is created exactly for this purpose. Watch this video to learn more. 


Monday 22 April 2019

Famous Personas in our Presentations

Inspirational quotes from famous personalities make a whole lot of difference. They help set the tone of presentation and directly underscore your point. 

Steve Jobs hand drawn PowerPoint visual  


But are you willing to google up an image (of a famous personality) and copy the image and paste it into your slide? We never recommend that... it can be a copyright violation and sounds unprofessional too. Here is where DrawingBoard can be a real handy tool, it has dozen of hand drawn famous personas just a click away. 

Check it out.

https://www.next2office.com

hashtag

Thursday 18 April 2019

The power of Drag-&-Drop in PowerPoint

More often than not presentations are always the last moment thing! 

You are running out of time and boss needed the presentation yesterday... trust me happens all the time! What do we do in such cases??

Google 100s of 1000s of ideas? 
Use your colleagues help?
Create something out of the box in no time?.... and the list goes on! 

But, none of the ideas above can be easy! They are possible but they take their own sweet time, which you don't have!! This is where you need a Drag-&-Drop booster. Check it out:


Simply search what you looking for and locate the right object. Once you got the right object simply Drag-&-Drop into your slide and bingo!!! Its all your to edit customize improve and create the awesomeness that you always wanted. 


5 tips for a conference presentation

Here are my thoughts for a conference (large audience large meeting room + projector presentation).
  1. At least 50% (or more) image area 50% (or less) text area for each slide. Usually I prefer one supporting image per slide. It acts as a visual trigger and tells directly what you are going to focus on. And I have noticed that as soon as your audience sees an image they turn their attention back on you. And this what you want…. all eyes on you. If you add too much text then people start reading it and everybody is at different points on the slide. Its all over the place…actually a mess.
  2. Bigger Fonts for your text. I would avoid smaller fonts (12 or below)
  3. Highlight as much as possible what is the key message or key point on your slide
  4. Use a roadmap trick. This is my favorite. If you have 5 or 6 or 7 main points/flows to present. Then put them all in one slide and then on next 5 or 6 or 7 slides just put a visual indicating where you are on the flow.
  5. Stay confident. Speak loud with passion and you be fine!! :)
Sample Conference Slide 
Just in case you are wondering did I use any tool or addin..yes I built it using DrawingBoard addin.

Slide created using DrawingBoard PowerPoint Addin

Tuesday 16 April 2019

The power of Word Clouds in your presentation


Words tags or word cloud or work cluster or tag cloud are very novel and awesome visual tools to put forward your point in a very direct and compelling way! Word clouds can add a wow factor immediately to your PowerPoint slide. Word clouds help grab the attention of our audience in a snap, they also help your audience connect with the main point in no time.

Just in case if you are wondering what is word cloud here is a simple definition:

All the words in a word cloud are related to a central idea and are in various fonts of various colors with the main word (central idea) being in the center of the cloud and it’s of the largest font.


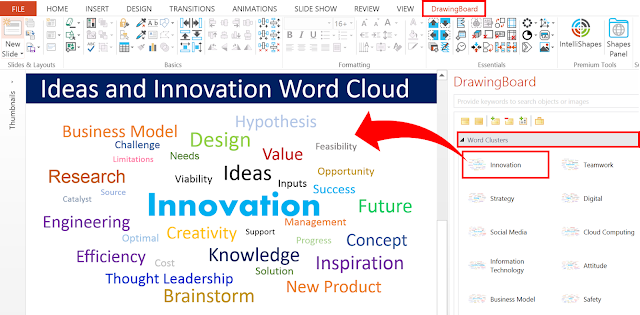
Below is an example of “Innovation Word Cloud”. The word innovation is in the center surrounded by related words in various fonts and colors. Generally smaller the font of a word, weaker the relation of that word with the central idea.


Innovation word cloud 

But, creating word clouds manually can be a very tiresome job… first to gather the right words and then positioning them in various fonts and colors. This is where DrawingBoard PowerPoint Add-in can make your day! Access dozens of word clouds at your fingertips just search for the word cloud and drag it into your slide and you are done!!! Isn’t that cool….

Try it out.

Monday 15 April 2019

4 point framework makeover with editable PowerPoint Infographic templates using DrawingBoard add-in


Here’s how we used DrawingBoard PowerPoint addon and applied an infographic template to jazz up a simple 4 point framework for Digital Innovation. Isn’t it cool…. & guess what, our client just loved it!


Infograhic makeover of a 4 point framework with DrawingBoard PowerPoint Add-in


The DrawingBoard PowerPoint add-in is packed with thousands of such pre-built professionally designed editable PowerPoint infographic templates. 

Simply open the shapes panel and search alphabet ‘4’or ‘four’ and you will find a huge collection of infographics. Move your mouse on the thumbnails and check out its description and usage. Now simply double click on the thumbnail or drag-and-drop it right into your slide and start editing it. It’s that simple!


Three ways to convert a simple PowerPoint bar chart into awesome infographics


Bar charts have been there for ages now and they do a decent job at visual data comparison.  But have you thought of giving an infographic twist to native ppt bar chart? If not, it’s worth it and it works!!! 

We have tried the following 3 ideas for infographic makeover of the native PowerPoint and our clients love it! We are getting huge traction towards creating such make overs if more and more ways. Let me share the 3 ideas which have given us a huge edge:
 
Infographic Makeover of PowerPoint Bar Chart
 
Infographic makeover idea # 1: Bars as 3D Projections
The length of the horizontal bars is in exact proportion to the lengths of the bars in the native ppt chart. The projected 3D part has the name of category or series name as we see it in the chart editor. This chart can be stretched in any way and can be squeezed easily to fit in smaller area thereby saving a lot of slide real estate and yet giving a Wow! Factor to your slide.
Infographic makeover idea # 2: Bars as Circular Rims
Here the lengths of the circular rims is in proportion to the values attached to them or in other words roughly the same spread as in the native ppt chart. Here we have to lock the aspect ratio for best results. This is one of our absolute favourites!!!
Infographic makeover idea # 2: Bars as Connected Circles
This sounds simple but works great. Here the size of circle is in proportion to the value of categories. We can also overlap the circles and still they look great! This approach to infographics has worked very well for us!
Let us know what you think.